
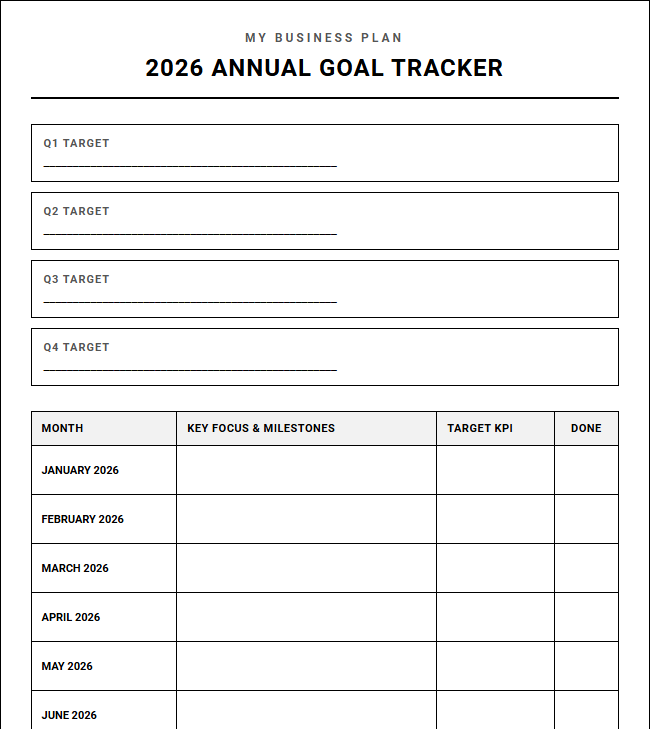
Scaling a business is challenging; most leaders struggle to align daily operations with long-term vision. While securing traditional funding sources provides a necessary runway, true growth requires disciplined execution. Structured planning grants organizations the strategic clarity needed to maximize capital. However, even tools like our printable Annual Business Goal Tracker require consistent team alignment to succeed. Below, we examine how to utilize this tracking framework to systematically achieve your yearly milestones.
Create Your Annual Business Goal Tracker
Done customizing?
Annual Business Goal Tracker - Good to Know
Objectives and Key Results (OKRs)
Objectives and Key Results (OKRs) represent a dynamic goal-setting framework utilized by high-growth organizations to define measurable goals and track their outcomes. The "Objective" outlines a qualitative, inspirational, and time-bound destination, while the "Key Results" specify the quantitative milestones required to achieve that target. Typically, an organization will set three to five high-level objectives with corresponding metrics to ensure focus and clarity.
Implementing this methodology fosters cross-functional collaboration and pushes teams to think beyond incremental progress. Key features of successful OKRs include:
- Aggressive yet realistic targets that encourage innovation and creative problem-solving.
- Complete transparency, allowing every employee to view the goals of peers and executives alike.
- Frequent grading cycles, usually quarterly, to evaluate performance and pivot strategies rapidly.
By shifting focus from output to actual business outcomes, organizations ensure that daily operational efforts yield tangible progress toward overriding company targets.
Key Performance Indicators (KPIs)
Key Performance Indicators (KPIs) serve as the quantifiable metrics that gauge an organization's ongoing operational success over time. Unlike temporary strategic goals, KPIs act as vital signs, continuously measuring the health and efficiency of core business processes. They provide managers with the precise data needed to determine whether specific departments, projects, or individual team members are meeting their baseline performance standards.
Establishing effective KPIs requires careful selection to avoid data overload. Organizations should focus on metrics that are directly actionable and highly relevant to their industry vertical. For instance:
- Financial metrics, such as net profit margin and monthly recurring revenue (MRR).
- Customer-centric metrics, including customer lifetime value (LTV) and net promoter score (NPS).
- Operational metrics, like inventory turnover and support ticket resolution time.
Regularly reviewing these indicators enables leadership to make evidence-based decisions, optimize resource allocation, and sustain steady growth.
Milestone Tracking
Milestone Tracking is a critical project management practice that involves identifying, monitoring, and celebrating key achievements along a project's timeline. Milestones act as significant checkpoints that transition a project from one major phase to the next. By breaking down monumental initiatives into manageable, sequential phases, teams can mitigate risk and maintain high morale throughout the project lifecycle.
"Tracking milestones provides stakeholders with visible proof of progress, ensuring that complex initiatives remain on schedule and within budget parameters."
These checkpoints also serve as natural opportunities to pause, evaluate quality, and gather feedback before advancing. Successful milestone tracking requires clear definition of what constitutes completion. When teams establish concrete criteria for each milestone, they prevent scope creep, facilitate better resource scheduling, and ensure that potential bottlenecks are identified and resolved before they threaten the final delivery date.
Strategic Alignment
Strategic Alignment refers to the deliberate process of linking an organization's structure, resources, and daily operations directly to its long-term vision and mission. When alignment is achieved, every department, team, and individual contributor understands how their work supports the broader corporate strategy. This synchronization eliminates redundant tasks, reduces wasted resources, and ensures that everyone is pulling in the same direction.
Achieving total alignment requires continuous, transparent communication from executive leadership down to front-line staff. It is not a one-time event, but a continuous cycle of adjustment. Organizations must regularly review their strategic positioning in response to market shifts and technological advancements. By keeping internal capabilities and external goals in harmony, companies build a resilient infrastructure capable of executing complex strategies with precision, agility, and minimal friction across diverse business units.
North Star Metric
The North Star Metric is the single key metric that best captures the core value that a product or service delivers to its customers. It serves as a unifying beacon for the entire organization, guiding long-term product development, marketing campaigns, and customer success initiatives. Unlike generic financial goals, this metric focuses on sustainable, customer-centric growth that reflects true product engagement and long-term retention.
A well-defined North Star Metric must possess three distinct characteristics:
- It must lead directly to revenue generation and enterprise value.
- It must measure customer value creation, not just short-term transactions.
- It must be highly measurable and actionable for product development teams.
By aligning all departments around this singular focus, companies prevent conflicting priorities and channel collective efforts into initiatives that drive compound growth and lasting market leadership.
Cascading Goals
Cascading Goals represent an organizational management strategy where high-level corporate objectives are systematically translated down through every level of the hierarchy. Starting at the executive suite, strategic ambitions are broken down into divisional targets, which are then converted into team goals, and finally into individual daily tasks. This top-down translation ensures that every micro-action directly supports macro-level corporate success.
This methodology provides employees with a profound sense of purpose, as they can clearly trace the connection between their daily workload and the overall company vision. To implement this successfully, organizations must maintain open feedback loops. While goals flow downward, realistic performance data and operational insights must flow upward. This bi-directional communication ensures that goals remain realistic, highly relevant, and adaptable to changing circumstances on the ground, thereby fostering organizational unity and shared accountability.
Leading and Lagging Indicators
To measure progress accurately, organizations must balance their evaluation framework using both Leading and Lagging Indicators. Lagging indicators are historical metrics that confirm what has already occurred, such as quarterly revenue, customer churn rates, or annual net profit. While highly accurate and easy to measure, they only offer a retrospective view of organizational performance.
Conversely, leading indicators are predictive measures that signal future outcomes. Examples include:
- Sales pipeline velocity, which predicts future revenue generation.
- Customer onboarding completion rates, which signal future retention rates.
- Employee training hours, which indicate future operational efficiency.
By monitoring both indicator types, leadership can gain a comprehensive understanding of current health while actively adjusting strategies to influence future success before performance trends become irreversible.
Quarterly Business Review (QBR)
The Quarterly Business Review (QBR) is a formal, highly strategic meeting where executive leaders, department heads, and key stakeholders gather to evaluate the past quarter's performance and plan for the next. This review goes far beyond basic financial reporting; it serves as a critical forum to analyze operational challenges, celebrate major wins, and realign resources with shifting market opportunities.
A rigorous QBR agenda typically encompasses three critical phases:
- Retrospective analysis of key performance data, goals achieved, and lessons learned.
- Forward-looking planning to adjust strategic priorities, allocate budgets, and set upcoming targets.
- Risk assessment to identify potential market disruptions or internal bottlenecks.
These structured discussions keep leadership teams highly synchronized, foster cross-functional collaboration, and ensure the enterprise remains nimble, unified, and focused on executing its overarching long-term strategy.
Action Item Accountability
Action Item Accountability is the cornerstone of successful execution within any professional setting. Even the most brilliant strategy will fail without a structured framework that ensures tasks are carried out efficiently and on schedule. True accountability means that every single task, decision, and project component is explicitly assigned to a single owner who is responsible for its ultimate delivery.
To cultivate this culture of ownership, organizations must establish clear parameters for every action item. This involves defining precise deliverables, setting firm deadlines, and establishing clear quality standards from the outset. Regular status updates and transparent tracking tools allow teams to monitor progress collectively, identify potential delays early, and offer support to peers when needed. This systematic approach eliminates ambiguity, reduces finger-pointing during setbacks, and drives a high-performance culture rooted in trust and reliable execution.
Performance Dashboard
A Performance Dashboard is a sophisticated, real-time visual management tool that aggregates, tracks, and displays critical organizational metrics from multiple data sources. By converting raw data into intuitive charts, graphs, and progress bars, these dashboards democratize information and provide decision-makers at all levels with instant, actionable insights into operational health.
An effective dashboard design prioritizes clarity and relevance over sheer volume of information. Key elements of high-performing dashboards include:
- Real-time data integration, ensuring that all displayed information is current and accurate.
- Customizable views tailored to the specific needs of different roles and departments.
- Visual alerts, such as color-coded indicators, to instantly highlight metrics that require immediate attention.
By transforming complex datasets into a single source of truth, dashboards empower teams to make rapid, data-driven decisions that enhance productivity and sustain competitive advantage.
Leave a comment