
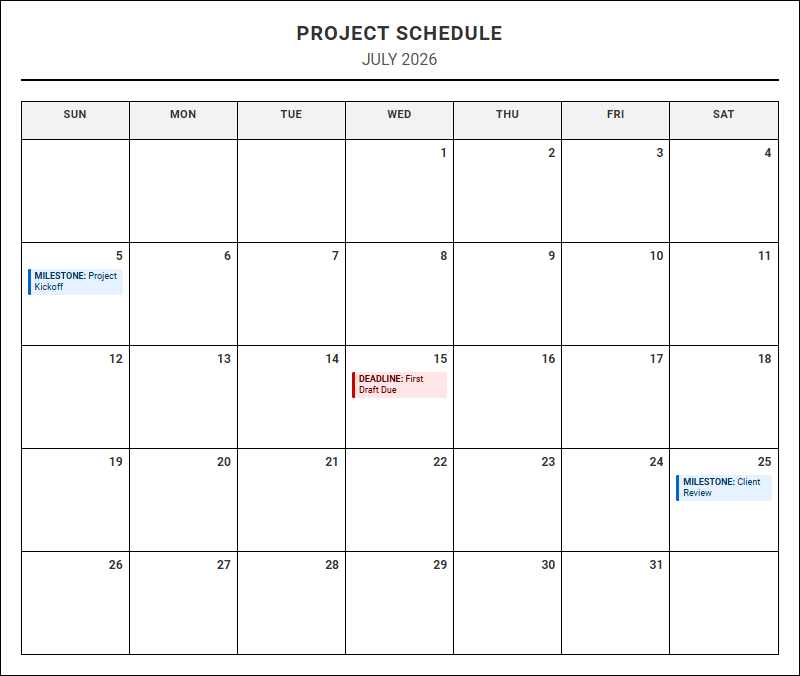
Staying on top of complex project timelines often feels like an uphill battle. While securing capital through traditional funding sources gets initiatives off the ground, execution remains the true hurdle. A dedicated Project Milestone and Deadline Tracker printable calendar grants teams the visibility needed to prevent bottlenecks. Note: these physical templates require active, daily updates to be fully effective. Proven in software development and marketing launches, we will examine how to implement this tool successfully.
Create Your Project Milestone and Deadline Tracker
Done customizing?
Project Milestone and Deadline Tracker - Good to Know
Gantt Chart
A Gantt chart serves as a foundational horizontal bar chart used extensively in modern project management to visually represent a project schedule. It maps out individual tasks, operational phases, and resource allocations against a continuous timeline, illustrating start and finish dates of the terminal elements of a project. By utilizing this visual framework, project managers can easily identify task overlaps, determine the overall duration of the project, and monitor real-time progress against planned timelines.
Using this dynamic tool provides team members with several advantages:
- Visual scheduling: Displays tasks, durations, and overlaps along a linear timeline.
- Progress monitoring: Shallows or shades bars to represent completed work in real-time.
- Resource allocation: Helps identify which team members are assigned to specific activities.
This clear layout ensures that internal and external stakeholders remain fully aligned on upcoming deadlines and phase transitions, making it an indispensable tool for complex operational coordination across diverse, cross-functional teams.
Critical Path Method
The Critical Path Method (CPM) is a mathematically formulated project management technique used to identify the sequence of crucial tasks that directly determine the overall duration of a project. It calculates the longest path of planned activities to the end of the project, as well as the earliest and latest that each activity can start and finish without making the project longer. Any delay in a critical path task directly impacts the final delivery date, making its identification vital for risk mitigation.
Understanding this methodology allows teams to focus their efforts on high-impact areas:
- Optimizes resource allocation by focusing on high-priority, sequential tasks.
- Calculates early/late start and finish dates for each task.
- Identifies "float" or "slack" time available for non-critical activities.
By isolating these essential operations, project managers can strategically allocate resources to prevent bottlenecks and streamline delivery, ensuring that vital milestones are met without unexpected delays.
Milestone Trend Analysis
Milestone Trend Analysis (MTA) is a specialized, graphical tool used to monitor the progress of key milestones over the lifecycle of a project. By tracking milestone target dates at regular reporting intervals, this method reveals whether a project is trending toward on-time completion, experiencing systemic delays, or progressing ahead of schedule. The graphical output typically plots reporting dates on the horizontal axis and planned milestone achievement dates on the vertical axis.
When these plotted lines trend upward, it indicates potential delays, whereas downward slopes signify early accomplishments. Regular MTA reviews enable project leads to:
- Detect schedule slippage early in the execution phase.
- Analyze historical scheduling accuracy to improve future planning.
- Communicate high-level timeline health clearly to executives and external stakeholders.
This systematic review process transforms passive milestone tracking into a predictive management system, enabling project teams to implement preventive measures long before deadlines are missed.
Slippage Tracking
Slippage tracking is the systematic process of measuring the discrepancy between the planned schedule baseline and the actual execution timeline. When a task or milestone finishes later than originally projected, the difference is defined as "slippage." Continuous monitoring of slippage allows project management offices (PMOs) to quantify schedule deviations, pinpoint the root causes of delays, and implement swift corrective actions before minor setbacks cascade into major project failures.
Effective tracking involves several key procedural steps:
- Establishing a firm schedule baseline prior to project execution.
- Comparing actual progress updates against baseline dates regularly.
- Documenting variance reasons, such as scope creep or resource constraints.
By maintaining a rigorous, ongoing log of these deviations, teams develop a robust historical performance database that enhances the accuracy of future estimation cycles and project planning initiatives.
Burndown Chart
Frequently utilized in Agile software development frameworks like Scrum, a burndown chart is a highly visual, graphical representation of work left to do versus time. The vertical axis represents the outstanding work, often measured in story points, tasks, or hours, while the horizontal axis represents the remaining time, typically sprints or days. It features an ideal progress line alongside an actual progress line, allowing the team to quickly assess whether they are on track to complete the planned scope.
This simple yet powerful chart offers several key benefits to self-organizing teams:
- Provides immediate daily feedback on team velocity and work capacity.
- Highlights scope changes if the outstanding work line suddenly spikes upward.
- Encourages collaborative decision-making during daily standup meetings.
By visualizing the remaining effort rather than focusing solely on what has been done, teams can manage workloads dynamically and make data-driven scope adjustments during active sprints.
RAG Status
The Red-Amber-Green (RAG) status is a ubiquitous reporting system used to communicate project health and performance metrics instantly. By assigning a color code to specific project dimensions-such as schedule, budget, scope, and resources-project managers can convey complex status information in an easily digestible format for all organizational stakeholders.
The standard definitions typically follow this structured framework:
- Red: Indicates critical issues requiring immediate executive intervention or corrective action.
- Amber: Signals minor deviations or emerging risks that require close monitoring to prevent escalation.
- Green: Confirms that the project area is progressing as planned, within budget, and on schedule.
Implementing this standardized indicator streamlines stakeholder communications, allowing busy executives to focus their attention on troubled areas while maintaining high confidence in on-track initiatives.
Schedule Variance
Schedule Variance (SV) is a vital quantitative metric used within Earned Value Management (EVM) to calculate how much a project is ahead or behind its planned timeline. Mathematically expressed as the difference between Earned Value (EV) and Planned Value (PV), Schedule Variance translates timeline progress into a monetary or hour-based value. A positive SV indicates that the project is ahead of schedule, whereas a negative SV signals that the project is lagging behind.
To contextualize this metric, project controls analysts often assess three key indicators:
- Earned Value (EV): The budgeted cost of work actually performed.
- Planned Value (PV): The budgeted cost of work scheduled to be completed.
- Schedule Performance Index (SPI): The ratio of EV to PV, indicating schedule efficiency.
By integrating SV into standard reporting, organizations gain a precise, objective measure of performance that transcends subjective guesses and manual status updates.
Timeboxing
Timeboxing is a time management technique that allocates a fixed, non-negotiable maximum unit of time-called a "timebox"-to a specific activity, task, or phase. Instead of working on a task until it is completed, team members focus on making as much progress as possible within the designated timeframe. When the timebox expires, work stops immediately, and progress is assessed to determine next steps. This approach is highly effective for:
- Combating perfectionism and eliminating unproductive over-engineering.
- Fostering intense focus and accelerating team decision-making.
- Ensuring predictable delivery cadences in agile environments.
By constraining the temporal dimension of a project, timeboxing forces teams to prioritize high-value features and activities, maximizing return on effort and ensuring that essential goals are achieved without endless expansion of project scope.
Dependency Mapping
Dependency mapping is the strategic practice of identifying, documenting, and visualizing the relationships and interdependencies between various project tasks, teams, or external deliverables. In complex programs, a single delay can trigger a domino effect across multiple workstreams. Mapping these relationships ensures that teams understand what inputs they require from others before starting their work, as well as who relies on their outputs.
Key components of a robust dependency map include:
- Predecessors: Tasks that must be completed before a subsequent task can begin.
- Successors: Tasks that cannot start until an earlier task is finished.
- Cross-team dependencies: Deliverables shared between different organizational units.
This collaborative mapping exercise minimizes communication silos, reduces scheduling conflicts, and empowers project managers to proactively manage external risks before they impact the critical path.
Baseline Tracking
Baseline tracking involves comparing the active, real-time progress of a project against its originally approved master plan, known as the baseline. The baseline typically comprises the approved scope, cost, and schedule configurations, captured at the end of the planning phase. Once locked, this snapshot serves as the standard yardstick against which future performance is measured.
By continuously measuring variances against this reference point, organizations can:
- Accurately assess historical project performance and execution efficiency.
- Validate the quality of initial estimations and planning assumptions.
- Provide verifiable data to justify formal change control requests.
Without a defined baseline, evaluating whether a project is truly successful or failing becomes nearly impossible, as there is no consistent standard for comparison. Consistent baseline tracking provides the clarity needed for continuous improvement.
Leave a comment